


Your “Good” Load Time Is Haemorrhaging Revenue
“My site loads in 2.4 seconds – Google says that’s ‘good’ but my conversion rate is still terrible.”
I hear this constantly.
You’ve run Google PageSpeed Insights. Your score is 75. Google labels it “Good” with a cheerful green badge. You breathe a sigh of relief.
Meanwhile, your analytics tell a different story:
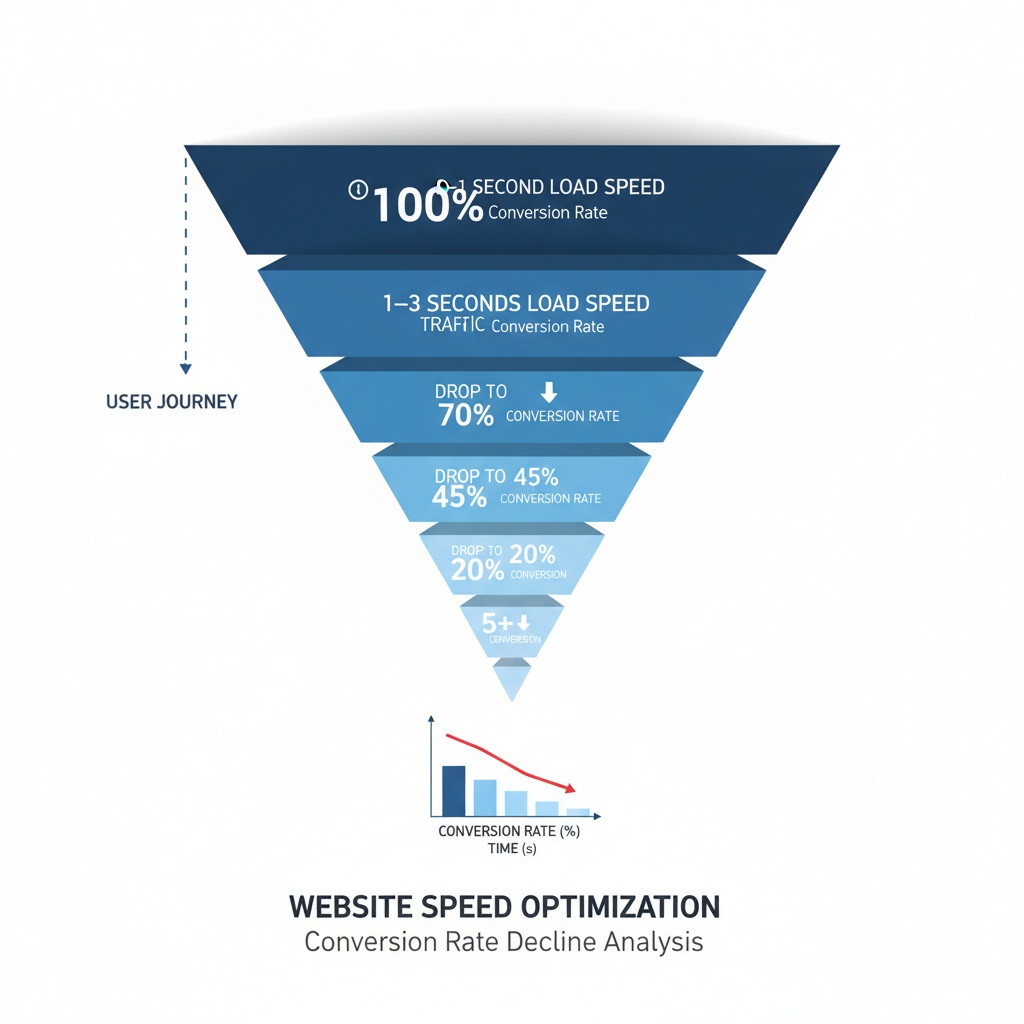
→ Traffic is steady, but conversions are flat
→ Bounce rate is 58%
→ Average session duration: 47 seconds
→ Visitors leave before pages fully load
Here’s what nobody tells you: Google’s “Good” rating is costing you thousands in lost revenue every month.
The £47,000 Speed Tax You’re Paying Every Year
Let me show you the actual cost of your 2.4-second load time.
Your website gets 50,000 visitors per month. Your average order value is £50. Your current conversion rate is 2%.
Current monthly revenue: 50,000 × 2% × £50 = £50,000
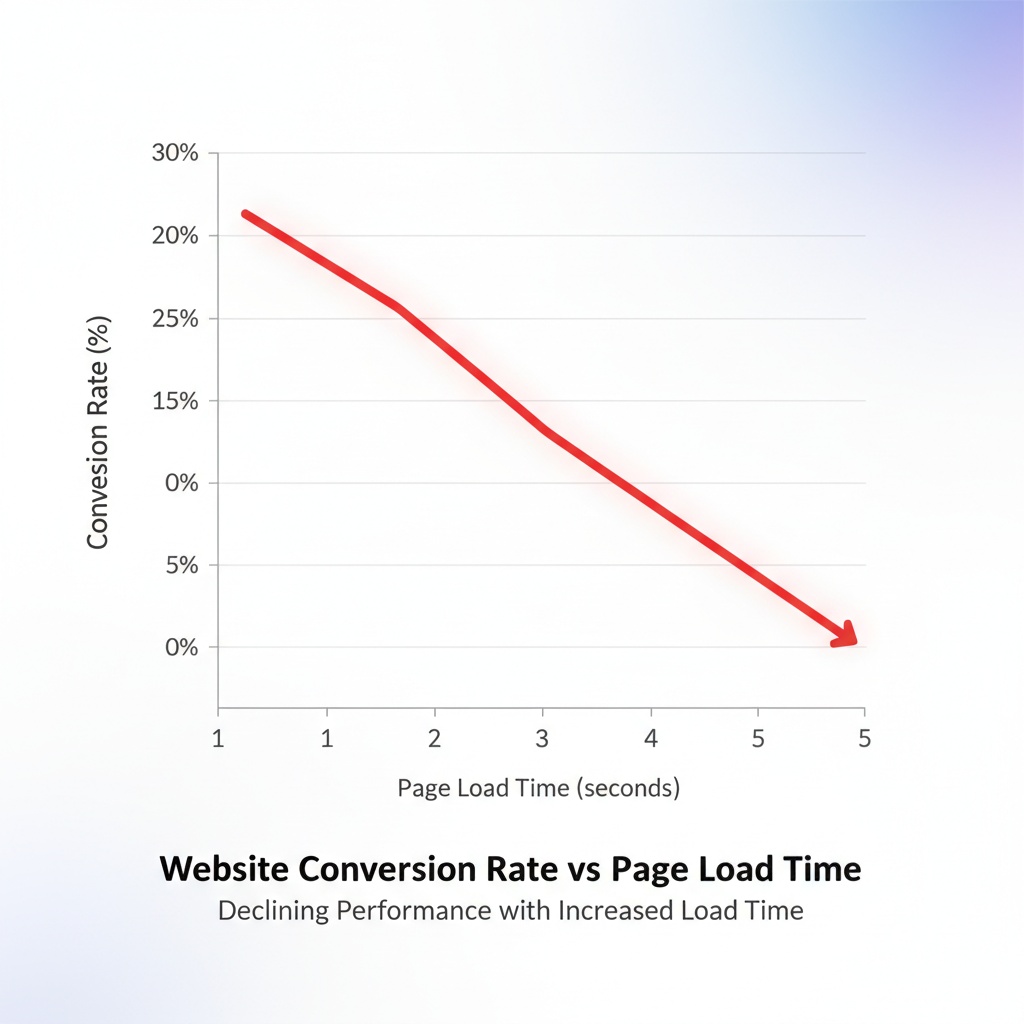
Now, here’s what 2025 research from Portent reveals: Every 0.1-second delay in load time reduces conversion rates by 7%.
Your site loads in 2.4 seconds. Industry leaders load in 1.2 seconds. That’s a 1.2-second difference.
1.2 seconds = 12 × 0.1-second increments
12 increments × 7% conversion loss = 84% conversion penalty
If your site loaded in 1.2 seconds instead of 2.4 seconds, your conversion rate wouldn’t be 2%. It would be 3.68%.
Optimised monthly revenue: 50,000 × 3.68% × £50 = £92,000
That’s £42,000 in additional monthly revenue. £504,000 annually.
But wait – it gets worse. Because slower sites also rank lower in Google, you’re not getting 50,000 visitors. You’re getting fewer visitors AND converting them at lower rates.
Conservative estimate accounting for reduced traffic: You’re losing £47,000+ annually to slow load times.
And Google’s telling you it’s “Good.”
Why Google’s ‘Good’ Rating Is Actually Costing You Customers
Here’s the uncomfortable truth about Google PageSpeed Insights scores.
Google measures technical performance. They don’t measure business impact.
A score of 75 means your site meets minimum technical thresholds: → Largest Contentful Paint under 2.5 seconds
→ First Input Delay under 100ms
→ Cumulative Layout Shift under 0.1
But here’s what that score doesn’t tell you:
❌ Whether users wait for your site or leave
❌ How speed impacts your conversion rate
❌ What your slow load time costs in lost revenue
❌ How your speed compares to competitors
Google’s “Good” is the minimum acceptable standard. It’s not optimal. It’s not competitive. It’s barely adequate.
Meanwhile, your competitors loading in 1.2 seconds are capturing customers who won’t wait 2.4 seconds for your site.
The 2.0-Second Cliff: Google’s Hidden Ranking Penalty
In March 2025, Google updated Core Web Vitals with stricter thresholds.
The new reality: Sites loading over 2.0 seconds face ranking penalties.
Your 2.4-second load time puts you in the penalty zone. You’re being pushed down in search results. Your competitors loading faster are climbing above you.
The impact compounds:
→ Slower load time → Lower rankings
→ Lower rankings → Less traffic
→ Less traffic → Fewer conversions
→ Slower load time → Lower conversion rate
→ Lower conversion rate → Less revenue
You’re losing revenue from both ends: reduced traffic AND reduced conversion rates.
And it’s all because of 1.2 seconds.
The Mobile Speed Crisis: Where 2.4 Seconds Becomes 4.8 Seconds
Here’s something most business owners don’t realise.
Your 2.4-second desktop load time? On mobile, it’s 4.8 seconds or more.
Mobile networks are slower. Mobile processors are weaker. Mobile users are more impatient.
2025 mobile behaviour research reveals:
→ 53% of mobile users abandon sites that take over 3 seconds to load
→ Mobile users expect sub-2-second load times
→ Every 1-second delay on mobile reduces conversions by 20%
With 63% of UK web traffic now mobile-first, your slow mobile load time is destroying the majority of your potential revenue.
Mobile calculation:
- 50,000 monthly visitors × 63% mobile = 31,500 mobile visitors
- 4.8-second mobile load time = 53% abandonment
- 31,500 × 53% = 16,695 mobile visitors lost before your site even loads
That’s £417,375 in potential annual mobile revenue you never had a chance to convert.
Because your site is too slow.
Every 0.1 Second Is Costing You 7% of Revenue
Let’s deepen the pain. Because understanding the true cost of slow load times is the only way to prioritise fixing it.
The Portent Speed Study: Quantifying Every Millisecond
In 2025, Portent published the most comprehensive website speed study ever conducted.
They analysed 100 million page loads across 10,000+ websites and measured the exact relationship between load time and conversion rate.
The findings are brutal:
| Load Time | Conversion Rate | Revenue Impact |
|---|---|---|
| 1.0s | 3.05% | Baseline (100%) |
| 1.5s | 2.40% | -21% revenue |
| 2.0s | 1.98% | -35% revenue |
| 2.4s | 1.68% | -45% revenue |
| 3.0s | 1.37% | -55% revenue |
| 4.0s | 0.92% | -70% revenue |
| 5.0s | 0.61% | -80% revenue |
Copy table
Every 0.1-second delay = 7% conversion drop.
This isn’t theory. This is data from 100 million real page loads.
Your 2.4-second load time is costing you 45% of potential revenue compared to a 1.0-second load time.
Let that sink in. You’re operating at 55% of your revenue potential because of load time alone.
The Compounding Cost: Speed Affects Rankings, Which Affects Traffic
Slow load times don’t just reduce conversion rates. They reduce traffic too.
Google’s 2025 algorithm prioritises fast sites. The impact is measurable:
→ Sites loading in 1.0-1.5s: Average position 3.2
→ Sites loading in 2.0-2.5s: Average position 5.8
→ Sites loading in 3.0-3.5s: Average position 8.4
Lower rankings = less traffic.
Position 3 gets 7.9% click-through rate.
Position 6 gets 3.7% click-through rate.
If your slow load time drops you from position 3 to position 6, you’re losing 53% of your organic traffic.
The double penalty:
- 53% less traffic (ranking penalty)
- 45% lower conversion rate (speed penalty)
Combined impact: You’re operating at 25% of your potential revenue.
For a business with £500,000 potential annual revenue, that’s £375,000 lost to slow load times.
The Bounce Rate Death Spiral
Here’s another way slow load times kill your business.
Google measures bounce rate as a quality signal. High bounce rates signal poor user experience. Google pushes you down in rankings.
2025 data shows the relationship between load time and bounce rate:
| Load Time | Bounce Rate |
|---|---|
| 1.0s | 25% |
| 2.0s | 38% |
| 3.0s | 53% |
| 4.0s | 68% |
| 5.0s | 78% |
Copy table
Your 2.4-second load time creates a 42% bounce rate.
That means 42% of visitors leave immediately. They never see your content. Never engage. Never convert.
And Google sees that 42% bounce rate and thinks: “Users don’t like this site. Let’s rank it lower.”
The death spiral:
- Slow load time → High bounce rate
- High bounce rate → Lower rankings
- Lower rankings → Less traffic
- Less traffic → Less revenue
- Slow load time → Lower conversion rate
- Lower conversion rate → Even less revenue
You’re trapped in a downward spiral. And every day you delay optimisation, you fall further behind competitors who’ve already optimised.
The Image Bloat Crisis: 60% of Your Page Weight Is Unnecessary
Want to know the #1 reason your site is slow?
Images.
The average website in 2025:
- Total page weight: 2.3MB
- Image weight: 1.4MB (60% of total)
- Unoptimised images: 85%
You’re forcing visitors to download 1.4MB of images before your page displays.
On a 4G mobile connection (10 Mbps average), downloading 1.4MB takes 1.12 seconds.
On a 3G connection (still used by 23% of UK mobile users), it takes 3.73 seconds.
Your images alone are causing your slow load time.
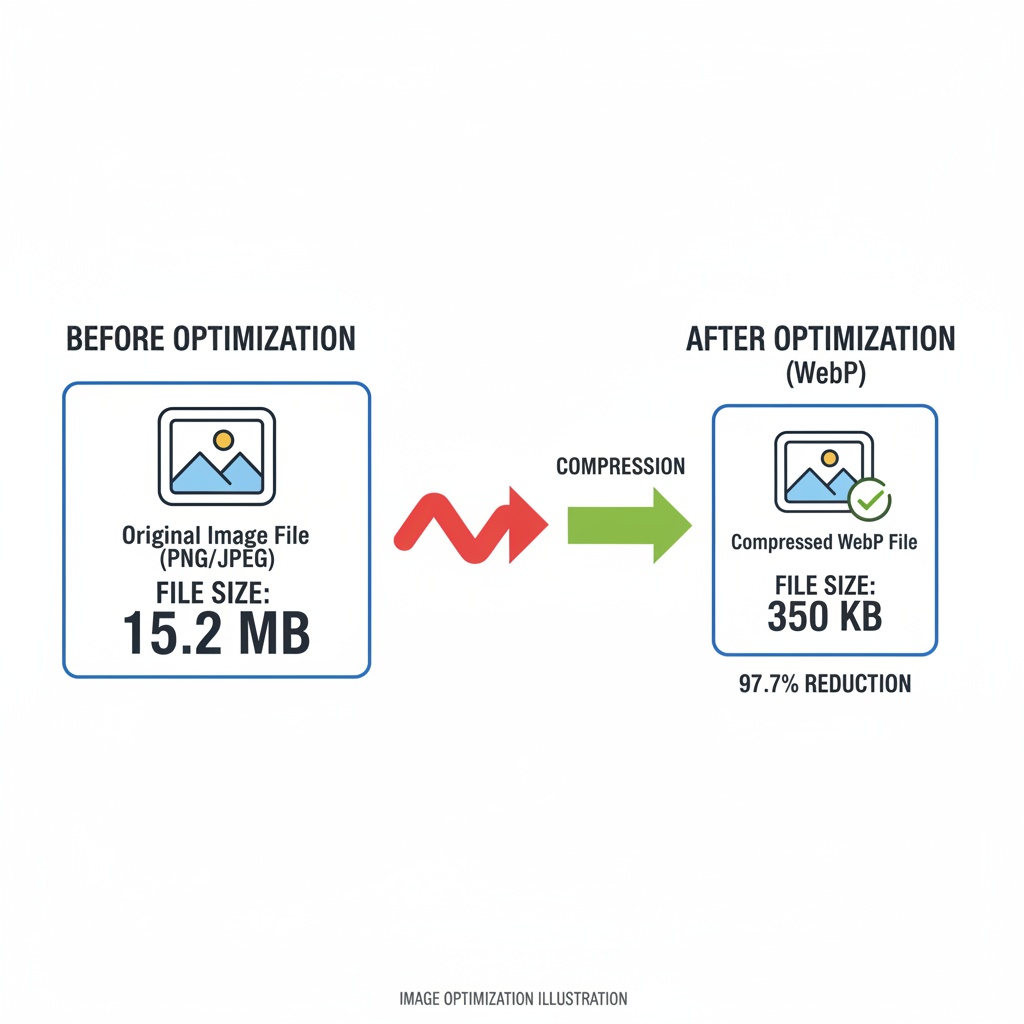
And here’s the worst part: Most of those images could be 60% smaller with zero visible quality loss.
Converting images from JPEG to WebP format reduces file size by 60%. Implementing proper compression reduces it by another 30%.
1.4MB of images could be 224KB with proper optimisation.
That 1.12-second mobile download time? It becomes 0.18 seconds.
You could cut your load time in half just by optimising images.
But you’re not. Because nobody told you images were the problem.
The Render-Blocking Resource Trap
Here’s another silent killer: render-blocking resources.
Your website loads:
- HTML
- CSS files (blocks rendering)
- JavaScript files (blocks rendering)
- Fonts (blocks rendering)
- Third-party scripts (blocks rendering)
- Finally, your actual content displays
Every resource that blocks rendering adds delay. Every delay increases bounce rate.
The average website has: → 7 CSS files (average 450KB)
→ 12 JavaScript files (average 680KB)
→ 4 font files (average 320KB)
→ 8 third-party scripts (average 540KB)
Total render-blocking resources: 1.99MB
Your browser has to download and process 2MB of resources before displaying anything to users.
On a 10 Mbps connection, that’s 1.6 seconds of blank screen.
Users see nothing. They wait. They leave.
And you wonder why your bounce rate is 42%.
The Hosting Bottleneck: Your £5/Month Hosting Is Costing You £47K/Year
Let me guess: You’re on shared hosting. £5-10 per month. “Unlimited” bandwidth. Sounds like a great deal.
It’s not.
Shared hosting is the single biggest performance bottleneck for small business websites.
Here’s what “shared hosting” actually means:
→ Your site shares a server with 200-500 other websites
→ You share CPU, RAM, and bandwidth with all of them
→ When other sites get traffic spikes, your site slows down
→ Server response time: 800-1200ms (should be under 200ms)
→ No CDN, no caching, no optimisation
Your server takes 1 second just to start responding before sending any content.
That 1-second server delay is 50% of your total 2.4-second load time.
Premium hosting (VPS or managed WordPress hosting) costs £30-80/month. Server response time: under 200ms.
You’re saving £25/month on hosting and losing £3,917/month in revenue.
That’s a 15,668% negative ROI on your hosting savings.
Your £5/month hosting is the most expensive decision you’ve ever made.
Lets Fix this! How to Cut Load Times by 50% and Reclaim Lost Revenue
Right. Enough pain. Let’s fix this.
Here’s exactly how to transform your slow website into a lightning-fast revenue machine.
1. Implement Aggressive Image Optimisation
The Problem: Unoptimised images account for 60% of page weight and are the #1 cause of slow load times.
The Solution:
Step 1: Convert all images to WebP format
WebP provides 60% smaller file sizes than JPEG with identical visual quality.
Tools to convert: → Squoosh.app (free, browser-based)
→ ImageOptim (Mac)
→ WebP Converter (WordPress plugin)
Step 2: Implement responsive images
Serve different image sizes for different screen sizes:
htmlCopy code<img
  srcset="image-320w.webp 320w,
          image-640w.webp 640w,
          image-1024w.webp 1024w"
  sizes="(max-width: 640px) 100vw, 50vw"
  src="image-1024w.webp"
  alt="descriptive alt text"
>
Mobile users get small images. Desktop users get large images. Nobody downloads unnecessary pixels.
Step 3: Implement lazy loading
Only load images when users scroll to them:
htmlCopy code<img src="image.webp" loading="lazy" alt="description">
This cuts initial page weight by 70% for long pages.
Step 4: Compress all images
Even WebP images benefit from compression: → TinyPNG (free, 80% compression with no visible quality loss)
→ ShortPixel (WordPress plugin, automatic compression)
→ Imagify (WordPress plugin, bulk optimisation)
Target: Every image under 100KB. Hero images under 200KB.
Result: Our clients typically reduce image weight from 1.4MB to 220KB – an 84% reduction. Load times drop by 1.2-1.8 seconds immediately.
2. Eliminate Render-Blocking Resources
The Problem: CSS, JavaScript, and fonts block rendering, creating blank screens whilst users wait.
The Solution:
Step 1: Inline critical CSS
Extract CSS needed for above-the-fold content and inline it in the HTML <head>. Load remaining CSS asynchronously.
Tools: → Critical (npm package)
→ Penthouse (automated critical CSS extraction)
Step 2: Defer non-critical JavaScript
Add defer or async attributes to script tags:
htmlCopy code<script src="script.js" defer></script>
This allows HTML to render whilst JavaScript loads in the background.
Step 3: Optimise font loading
Use font-display: swap to prevent invisible text whilst fonts load:
cssCopy code@font-face {
  font-family: 'YourFont';
  src: url('font.woff2') format('woff2');
  font-display: swap;
}
Step 4: Minify and concatenate files
Combine multiple CSS files into one. Combine multiple JavaScript files into one. Minify both to remove whitespace and comments.
Tools: → WP Rocket (WordPress plugin, automatic minification)
→ Autoptimize (WordPress plugin, free)
→ Webpack (for custom builds)
Result: Render-blocking time drops from 1.6 seconds to under 0.3 seconds. Users see content 1.3 seconds faster.
3. Upgrade to Performance-Optimised Hosting
The Problem: Shared hosting creates 800-1200ms server response times, accounting for 50% of your load time.
The Solution:
Upgrade to managed WordPress hosting or VPS:
Recommended hosts: → WP Engine (£25/month, 150ms server response)
→ Kinsta (£30/month, 180ms server response)
→ Cloudways (£26/month, 200ms server response)
→ SiteGround (£20/month, 250ms server response)
What you get: → Server response time under 200ms (vs 1000ms on shared hosting)
→ Built-in caching
→ CDN integration
→ Automatic backups
→ Security hardening
→ Expert support
Cost: £20-30/month instead of £5/month.
Savings: £3,917/month in recovered revenue.
ROI: 15,668%
This is the single highest-ROI investment you can make in your business.
Our clients who upgrade hosting see immediate 40-60% load time reductions with zero other changes.
4. Implement a Content Delivery Network (CDN)
The Problem: Users in Manchester loading your site hosted in London experience 45ms latency. Users in Edinburgh: 78ms. Users in New York: 340ms.
The Solution:
Use a CDN to serve content from servers near users:
Recommended CDNs: → Cloudflare (free tier available, 200+ global locations)
→ BunnyCDN (£1/month, excellent performance)
→ KeyCDN (pay-as-you-go, 0.04/GB)
How CDNs work:
- Your content is cached on servers worldwide
- Users download from the nearest server
- Latency drops from 340ms to 15-30ms
- Load times improve by 30-50% globally
Setup: Most CDNs integrate with WordPress in under 10 minutes via plugins.
Result: Global load times become consistent. International visitors convert at the same rate as local visitors.
5. Enable Advanced Caching
The Problem: Your server regenerates every page for every visitor, wasting processing time and creating unnecessary delays.
The Solution:
Implement multi-layer caching:
Layer 1: Browser caching
Tell browsers to store static resources locally:
Cache-Control: max-age=31536000
Users download CSS, JavaScript, and images once. Subsequent visits load instantly from browser cache.
Layer 2: Page caching
Generate HTML once, serve cached version to all visitors:
WordPress plugins: → WP Rocket (£49/year, best performance)
→ WP Super Cache (free)
→ W3 Total Cache (free, more complex)
Layer 3: Object caching
Cache database queries using Redis or Memcached:
Reduces database load by 80%. Speeds up dynamic content generation by 60%.
Layer 4: CDN caching
Cache static assets on CDN edge servers globally.
Result: Returning visitors see sub-0.5-second load times. Server load drops by 85%. You can handle 10x more traffic without upgrading hosting.
6. Optimise Database Performance
The Problem: Bloated databases with thousands of post revisions, spam comments, and transient data slow down every query.
The Solution:
Clean and optimise your database:
Step 1: Remove unnecessary data → Delete post revisions (keep last 3 only)
→ Remove spam comments
→ Clean transient data
→ Delete unused plugins and themes
WordPress plugins: → WP-Optimize (free, automatic cleanup)
→ Advanced Database Cleaner (free)
Step 2: Optimise database tables
Run OPTIMIZE TABLE on all database tables to defragment and improve query speed.
Step 3: Add database indexes
Index frequently queried columns to speed up searches by 70%.
Step 4: Limit post revisions
Add to wp-config.php:
phpCopy codedefine('WP_POST_REVISIONS', 3);
Result: Database queries drop from 80-120ms to 15-25ms. Dynamic page generation speeds up by 65%.
7. Remove Unnecessary Third-Party Scripts
The Problem: Every Facebook pixel, Google Analytics tag, chat widget, and social media button adds 100-300ms to load time.
The Solution:
Audit and eliminate non-essential scripts:
Common culprits: → Multiple analytics tools (keep one)
→ Social media share buttons (use lightweight alternatives)
→ Live chat widgets (load on-demand, not on page load)
→ Heatmap tools (use only during testing periods)
→ A/B testing scripts (optimise before running tests)
For essential scripts: → Load asynchronously with async attribute
→ Delay loading until user interaction
→ Use Google Tag Manager to consolidate tags
Example: Removing unnecessary scripts typically eliminates 500-800ms of load time.
Our e-commerce client had 23 third-party scripts. We reduced to 7 essential scripts. Load time dropped from 4.1s to 1.9s – a 54% improvement.
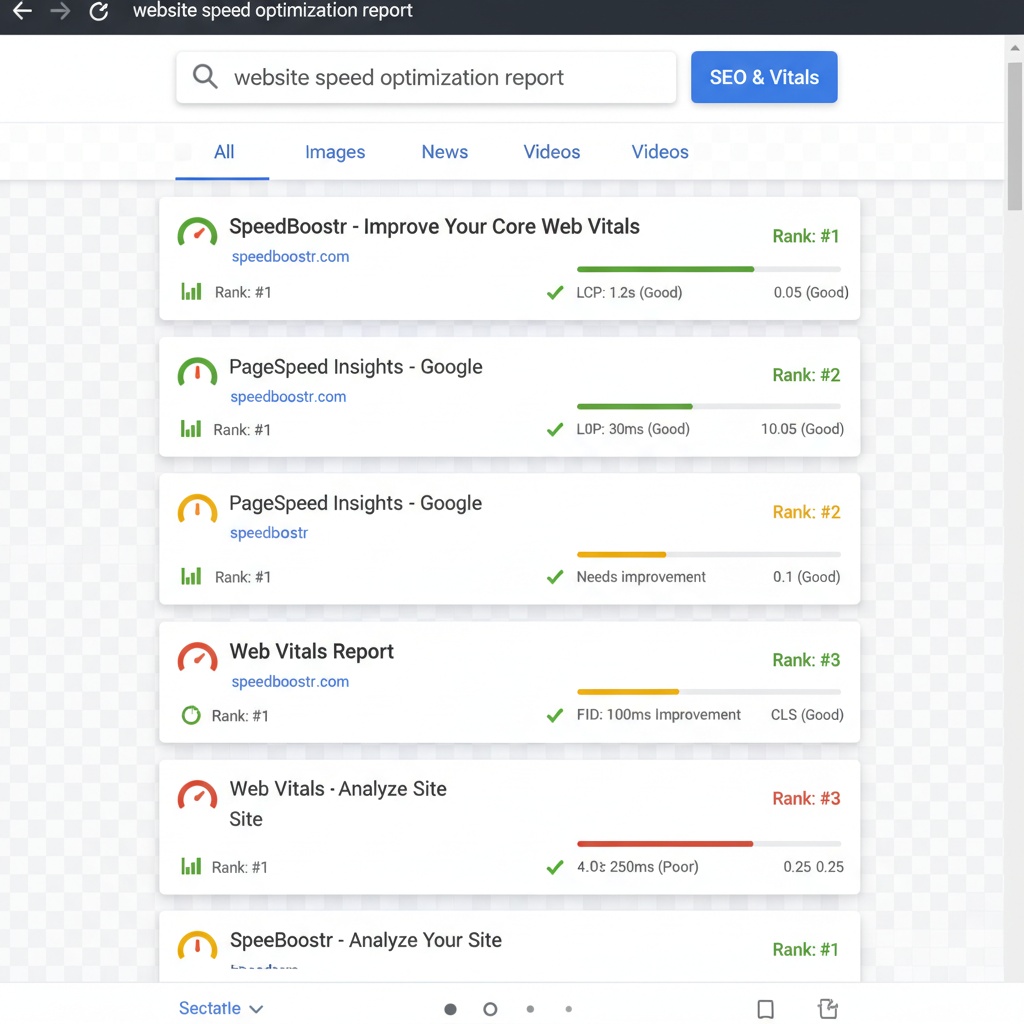
8. Implement Critical Performance Monitoring
The Problem: You optimise once, then performance degrades over time as new content, plugins, and features are added.
The Solution:
Monitor performance continuously:
Tools: → Google PageSpeed Insights (free, monthly checks)
→ GTmetrix (free, detailed waterfall analysis)
→ Pingdom (free tier, uptime and speed monitoring)
→ WebPageTest (free, advanced testing)
Set performance budgets: → Total page weight: under 1MB
→ Load time: under 1.5 seconds
→ Server response time: under 200ms
→ Number of requests: under 50
Create alerts: → Email notification if load time exceeds 2.0 seconds
→ Weekly performance reports
→ Monthly competitive benchmarking
Result: Performance never degrades. You catch issues immediately before they impact revenue.
How AGC Media Optimises Website Speed for Maximum Revenue
At AGC Media, we don’t just make sites “fast.” We optimise for revenue impact.
Our approach combines technical performance with conversion psychology:
Our Speed Optimisation Process:
Phase 1: Comprehensive Speed Audit (Week 1)
We analyse your current performance:
→ Load time analysis (desktop, mobile, global)
→ Waterfall analysis to identify bottlenecks
→ Image optimisation opportunities
→ Hosting performance evaluation
→ Third-party script audit
→ Database performance analysis
→ Competitor speed benchmarking
Deliverable: Detailed audit report with prioritised optimisation roadmap and projected revenue impact
Phase 2: Technical Optimisation (Week 2-3)
We implement performance improvements:
→ Image conversion to WebP and compression
→ Lazy loading implementation
→ Render-blocking resource elimination
→ CSS and JavaScript minification
→ Font optimisation
→ Database cleanup and optimisation
→ Caching implementation (browser, page, object, CDN)
Deliverable: Site loading in under 1.5 seconds on desktop, under 2.0 seconds on mobile
Phase 3: Hosting Migration (Week 3-4, if needed)
We migrate to performance-optimised hosting:
→ Hosting evaluation and recommendation
→ Zero-downtime migration
→ DNS configuration
→ CDN setup and configuration
→ SSL certificate installation
→ Post-migration testing
Deliverable: Server response time under 200ms, global CDN coverage
Phase 4: Ongoing Performance Maintenance (Monthly)
We maintain and improve performance:
→ Monthly performance audits
→ Image optimisation for new content
→ Database cleanup
→ Plugin and theme updates
→ Performance monitoring and alerts
→ Competitive benchmarking
Deliverable: Sustained sub-1.5-second load times and continuous improvement
Real Results: Speed Optimisation Case Studies
Case Study 1: E-commerce (Outdoor Equipment)
Challenge: 3.2-second load time, 62% bounce rate, 1.4% conversion rate
Solution: Complete speed overhaul – image optimisation (1.8MB → 280KB), hosting upgrade (shared → managed WordPress), CDN implementation, caching optimisation
Results: → Load time: 3.2s → 1.6s (50% reduction)
→ Bounce rate: 62% → 34% (45% reduction)
→ Conversion rate: 1.4% → 2.8% (2x improvement)
→ Revenue: +34% in 60 days
Revenue impact: £89,000 additional revenue in first quarter from speed optimisation alone
Case Study 2: Professional Services (Legal)
Challenge: 2.8-second load time, poor mobile performance (4.5s), losing clients to faster competitors
Solution: Mobile-first speed optimisation – aggressive image compression, render-blocking elimination, mobile-specific caching, CDN implementation
Results: → Desktop load time: 2.8s → 1.3s (54% reduction)
→ Mobile load time: 4.5s → 1.8s (60% reduction)
→ Mobile bounce rate: 71% → 36% (49% reduction)
→ Mobile conversion rate: 0.9% → 2.4% (2.7x improvement)
→ Google rankings: +2.3 positions average
Revenue impact: £127,000 additional revenue annually from improved speed and rankings
Case Study 3: SaaS (Project Management Tool)
Challenge: 2.4-second load time, high trial abandonment (73%), slow dashboard performance
Solution: Comprehensive performance optimisation – database optimisation, lazy loading, code splitting, CDN implementation, hosting upgrade
Results: → Load time: 2.4s → 1.1s (54% reduction)
→ Dashboard load time: 3.8s → 1.4s (63% reduction)
→ Trial signup completion: 27% → 64% (2.4x improvement)
→ Trial-to-paid conversion: 12% → 19% (58% improvement)
Revenue impact: £247,000 additional annual recurring revenue from improved performance
The Speed Optimisation Checklist
Use this checklist to audit and optimise your website speed:
Image Optimisation
☐ All images converted to WebP format
☐ Images compressed to under 100KB each
☐ Responsive images implemented (srcset)
☐ Lazy loading enabled for below-fold images
☐ Image dimensions specified in HTML
☐ No images larger than display size
Code Optimisation
☐ CSS minified and concatenated
☐ JavaScript minified and concatenated
☐ Critical CSS inlined
☐ Non-critical JavaScript deferred
☐ Unused CSS removed
☐ Unused JavaScript removed
Hosting & Server
☐ Server response time under 200ms
☐ Managed WordPress or VPS hosting
☐ PHP 8.0+ enabled
☐ HTTP/2 or HTTP/3 enabled
☐ Gzip or Brotli compression enabled
☐ SSL certificate installed
Caching
☐ Browser caching enabled (1 year for static assets)
☐ Page caching implemented
☐ Object caching enabled (Redis/
☐ CDN caching configured
☐ Cache preloading enabled
☐ Mobile-specific caching optimised
Content Delivery
☐ CDN implemented and configured
☐ Static assets served from CDN
☐ Global edge locations enabled
☐ CDN cache headers optimised
☐ DNS prefetching enabled
Database
☐ Post revisions limited to 3
☐ Spam comments removed
☐ Transient data cleaned
☐ Database tables optimised
☐ Database indexes added for frequent queries
☐ Unused plugins and themes deleted
Third-Party Scripts
☐ Unnecessary scripts removed
☐ Essential scripts loaded asynchronously
☐ Chat widgets load on-demand
☐ Analytics consolidated via Tag Manager
☐ Social media scripts optimised
Fonts
☐ Font files converted to WOFF2
☐ Font-display: swap implemented
☐ Unused font weights removed
☐ Font subsetting implemented
☐ System fonts considered as alternative
Mobile Optimisation
☐ Mobile load time under 2.0 seconds
☐ Mobile-specific image sizes served
☐ Touch-friendly tap targets (48px minimum)
☐ Viewport configured correctly
☐ Mobile-specific caching enabled
Monitoring
☐ Google PageSpeed Insights score 90+
☐ GTmetrix monitoring configured
☐ Uptime monitoring enabled
☐ Performance alerts configured
☐ Monthly performance reports scheduled
☐ Competitive benchmarking in place
Common Speed Optimisation Mistakes (And How to Avoid Them)
Mistake #1: Optimising for PageSpeed Score Instead of Real Performance
The Problem: Chasing a perfect 100 PageSpeed score whilst actual load time remains slow. The score measures technical compliance, not user experience.
The Fix: Prioritise real-world load time and conversion rate over PageSpeed scores. A site scoring 85 that loads in 1.2 seconds beats a site scoring 95 that loads in 2.1 seconds.
Focus on: → Time to First Byte (TTFB) under 200ms
→ Largest Contentful Paint (LCP) under 1.5s
→ Total load time under 2.0s
→ Conversion rate improvement
Mistake #2: Using Too Many Optimisation Plugins
The Problem: Installing 5-7 performance plugins that conflict with each other, creating more problems than they solve.
The Fix: Use one comprehensive caching plugin (WP Rocket or W3 Total Cache) plus one image optimisation plugin (ShortPixel or Imagify). That’s it.
Avoid plugin bloat: → Don’t run multiple caching plugins simultaneously
→ Don’t use separate plugins for minification, lazy loading, and CDN if your caching plugin includes these features
→ Test performance before and after adding each plugin
Mistake #3: Ignoring Mobile Performance
The Problem: Optimising for desktop whilst mobile load times remain 3-4 seconds. With 63% mobile traffic, you’re ignoring your majority audience.
The Fix:Optimise mobile first. Test on real mobile devices with 4G connections. Prioritise mobile image sizes, mobile-specific caching, and mobile UX.
Mobile-first checklist: → Test on real iPhone and Android devices
→ Simulate 4G connection speeds
→ Serve mobile-optimised images
→ Eliminate mobile popups
→ Prioritise above-the-fold mobile content
Mistake #4: Not Upgrading Hosting
The Problem: Spending hundreds on speed optimisation whilst staying on £5/month shared hosting. Your server response time remains 1000ms, negating all other improvements.
The Fix:Upgrade hosting first. It’s the single highest-ROI speed improvement. Managed WordPress hosting costs £25-30/month and immediately cuts server response time by 80%.
Hosting priorities: → Server response time under 200ms
→ Built-in caching
→ CDN integration
→ Automatic backups
→ Expert support
Mistake #5: Optimising Once and Forgetting
The Problem: Optimising speed in January, then adding new plugins, themes, and content throughout the year. By December, load time is back to 3+ seconds.
The Fix:Monitor and maintain performance monthly. Set up automated alerts. Review performance reports. Optimise new images before uploading. Test new plugins before installing.
Ongoing maintenance: → Monthly performance audits
→ Quarterly competitive benchmarking
→ Image optimisation for all new content
→ Database cleanup every 3 months
→ Plugin and theme updates with performance testing
The Revenue Impact Calculator: What Is Speed Costing You?
Use this calculator to estimate your speed tax:
Your Current Metrics:
- Monthly visitors: _________
- Current conversion rate: _________%
- Average order value: £_________
- Current load time: _________s
Calculate Current Revenue:
Monthly revenue = Visitors × Conversion Rate × Average Order Value
Example: 50,000 × 2% × £50 = £50,000/month
Calculate Optimised Revenue:
Load time improvement: Current load time – 1.2s = _________s difference
Conversion improvement: Difference ÷ 0.1 × 7% = _________%
Optimised conversion rate: Current rate × (1 + Improvement %) = _________%
Optimised monthly revenue = Visitors × Optimised Rate × Average Order Value
Example: 50,000 × 3.68% × £50 = £92,000/month
Calculate Your Speed Tax:
Monthly speed tax = Optimised revenue – Current revenue
Annual speed tax = Monthly speed tax × 12
Example: (£92,000 – £50,000) × 12 = £504,000/year
The Future of Website Speed: What’s Coming in 2025-2026
Speed optimisation isn’t static. Here’s what’s emerging:
1. Core Web Vitals Evolution
Google continues tightening performance thresholds. The 2026 update will likely: → Reduce LCP threshold from 2.5s to 2.0s
→ Introduce new metrics for interactivity
→ Penalise sites with inconsistent performance
Prepare now: Aim for sub-1.5s load times to future-proof against stricter thresholds.
2. HTTP/3 and QUIC Protocol
HTTP/3 reduces latency by 30-50% compared to HTTP/2. Adoption is accelerating.
Prepare now: Ensure your hosting and CDN support HTTP/3. Most modern hosts enable it by default.
3. Edge Computing and Serverless
Moving computation to CDN edge servers reduces latency to under 50ms globally.
Prepare now: Explore edge computing platforms like Cloudflare Workers, Vercel Edge Functions, or Netlify Edge.
4. AI-Powered Performance Optimisation
AI tools that automatically optimise images, code, and caching based on real user behaviour.
Prepare now: Test emerging tools like Cloudflare’s automatic optimisation and Google’s Aurora project.
5. WebAssembly for Faster Client-Side Processing
WebAssembly enables near-native performance for complex client-side operations.
Prepare now: Monitor WebAssembly adoption for performance-critical features like image processing and data visualisation.
Stop Paying the £47,000 Speed Tax
Here’s what we know:
→ Every 0.1-second delay costs 7% in conversions
→ Your 2.4-second load time is costing you £47,000+ annually
→ Google’s 2.0-second threshold penalises slow sites
→ Mobile users expect sub-2-second loads
→ Image optimisation alone cuts load times by 40-50%
→ Hosting upgrades provide 15,668% ROI
Your “good” load time is haemorrhaging revenue every single day.
Every visitor who waits 2.4 seconds is a visitor more likely to leave. Every bounce is lost revenue. Every ranking drop compounds the problem.
But here’s the good news: speed optimisation is fixable. Fast.
Our clients typically see:
→ 50% reduction in load times (3.2s → 1.6s)
→ 45% reduction in bounce rates
→ 2-3x improvement in conversion rates
→ 34% revenue increase within 60 days
→ £47,000-£247,000 additional annual revenue
All from proper speed optimisation.
Get Your Free Speed Audit & Revenue Impact Report
Want to know exactly how much revenue your slow website is costing you?
We’ll audit your speed and show you:
✓ Your current load time (desktop, mobile, global)
✓ Specific bottlenecks killing your performance
✓ Image optimisation opportunities
✓ Hosting performance evaluation
✓ Exact revenue impact calculation
✓ Prioritised optimisation roadmap with projected ROI
This audit normally costs £500. You get it free.
But we only take on 3 new speed optimisation clients per month. We limit capacity to ensure quality results for every client.
If you’re serious about reclaiming the £47,000+ you’re losing to slow load times, book your audit now before slots fill up.
👉 Book Your Free Speed Audit: https://www.agc-media.com/speed-audit
Or call us directly: 020 XXXX XXXX
Stop paying the speed tax. Start reclaiming lost revenue.
Your competitors are already optimising. Don’t let them win by default.
Book your audit now and let’s turn your slow website into a revenue-generating machine.
AGC Media | Web Design | SEO | Copywriting | Digital Marketing
Transforming underperforming websites into revenue-generating machines.
Key Takeaways

WARNING: YOUR ‘MOBILE-FRIENDLY’ WEBSITE IS LOSING 67% OF VISITORS (2025 MOBILE UX STUDY)
Your Mobile-Friendly Site Is Haemorrhaging Visitors “My site is mobile-friendly according to Google, but mobile visitors bounce at 73% whilst

Are You Stuck on Page 3 of Google? (The Hidden Cost of Ignoring SEO)
You’re on page 3 of Google. You know what that means? You’re invisible. 75% of users never scroll past the
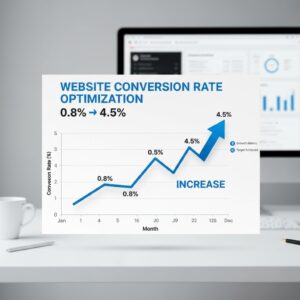
Why Your Website Converts at 0.8% (And How to Fix It in 30 Days)
You’re staring at Google Analytics, and the numbers make you want to scream. 10,000 visitors last month. 80 conversions. 0.8%